Worried your expensive e-bike battery will die prematurely? You see huge lifespan claims but hear horror stories. The secret isn't a number, but understanding what makes a battery last.
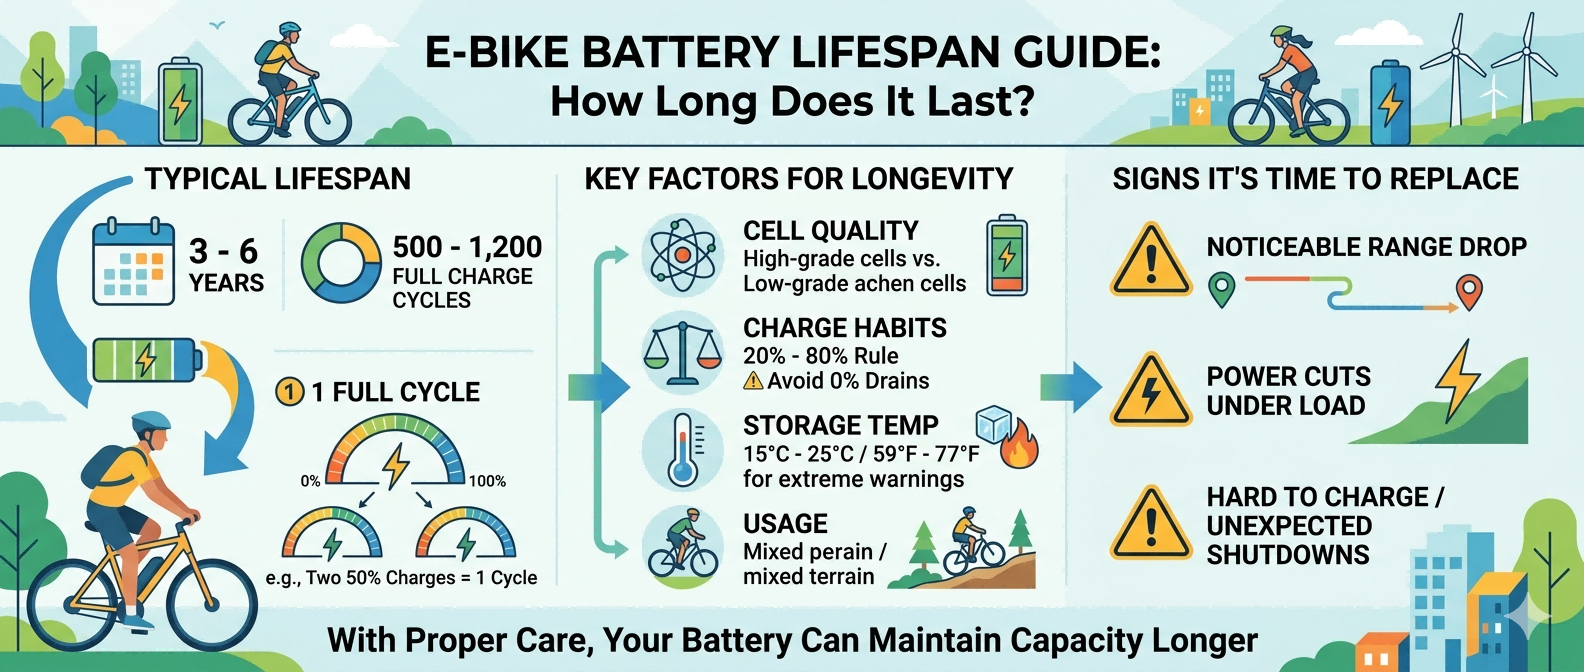
A quality e-bike battery should last between 3 to 5 years, or 500 to 800 full charge cycles, before its capacity falls below 80%.1 This lifespan depends more on the quality of internal cells and your usage habits than the advertised specifications on the box.2

In my 15 years of exporting e-bikes, the most common confusion I see is buyers mixing up two different "lifespans." The first is your bike's range on a single charge. The second, and far more important for your wallet, is the battery's total service life before it degrades and needs replacement. They are not the same thing. Understanding this difference is the first step to making a smart purchase and avoiding disappointment. Let's break down what really matters.
Why is a "500-cycle" rating on a spec sheet so misleading?
You see a battery advertised with a 1,000-cycle life, expecting years of use. But after one season, your range is already dropping fast. This happens because marketing numbers aren't real-world numbers.
A "charge cycle" on a spec sheet is measured in a perfect lab: controlled temperature, ideal charging speed, and shallow discharges.3 Real-world use with deep discharges, extreme weather, and inconsistent charging can cut that advertised cycle count by 40-60%4, a fact we see constantly in warranty discussions.

When a supplier claims 1,000, 1,500, or even 2,000 cycles, they are quoting a number achieved under impossible-to-replicate conditions. We've handled countless procurement consultations where this becomes a major point of negotiation. A buyer wants to promise their customers a 5-year battery life based on a lab spec, but we have to ground the conversation in reality. Real-world factors aggressively shorten that lifespan. For example, consistently draining your battery to 0% before recharging is much harder on it than charging it from 50%.5 Riding in freezing winters or peak summer heat also stresses the cells.6 Think of it like a car's fuel economy rating—the number on the sticker is rarely what you get in city traffic.
| Factor | Lab Condition (for spec sheet) | Real-World Condition (your usage) |
|---|---|---|
| Depth of Discharge | Shallow (e.g., 70% to 60%) | Deep (e.g., 100% to 10%) |
| Temperature | Stable 25°C (77°F)7 | Varies from -10°C to 40°C (14°F to 104°F) |
| Charging Rate | Slow and controlled (0.5C) | Often fast-charged for convenience (1C or higher) |
| Storage | Stored at 50% charge8 | Often left fully charged or empty for weeks |
Do all batteries with the same specs perform the same?
You're comparing two e-bikes. Both have "48V 20Ah" batteries, but one costs $500 more. It's tempting to think it's just branding, but the cheaper battery dies in 18 months while the other lasts for years.
Absolutely not. The brand and grade of the lithium-ion cells (e.g., Samsung, LG, Panasonic vs. generic) and the quality of the Battery Management System (BMS) are the true drivers of lifespan and safety.9 A higher price almost always reflects better, more durable internal components.

From our sourcing experience across Europe, North America, and Asia, this is where the most critical purchasing decisions are made. The voltage (V) and amp-hours (Ah) just tell you the size of the gas tank, not the quality of the engine. Inside the battery casing are the two components that matter most: the cells and the BMS. Tier 1 cells from brands like Samsung, LG, and Panasonic have highly consistent chemistry, meaning they degrade slowly and predictably.10 Lower-tier cells can have impurities and inconsistencies, leading to faster capacity loss and a higher failure rate. The BMS is the battery's brain.11 A cheap BMS might not balance the cells correctly during charging or fail to protect them from over-discharging, effectively killing the battery prematurely. When we build bikes for our clients, the choice between these component tiers is the biggest factor in the final cost and the length of the warranty we can confidently offer.
| Component Tier | Description | Impact on Lifespan & Cost |
|---|---|---|
| Tier 1 Cells | Samsung, LG, Panasonic | Highest consistency, slowest degradation. Expect 500-800+ real-world cycles. Higher upfront cost. |
| Tier 2 Cells | Reputable Chinese brands (e.g., EVE, BAK) | Good performance, but less consistent than Tier 1. Expect 400-600 real-world cycles. Mid-range cost. |
| Tier 3 / Unbranded | Unknown or recycled cells | Highly inconsistent, fast degradation, higher safety risk. May only last 200-300 cycles. Lowest cost. |
How can I tell if my battery is dying or just degrading normally?
Your e-bike's range isn't what it used to be, and you're worried. Is the battery defective and eligible for a warranty claim, or is this just normal wear and tear?
Normal degradation is a gradual, predictable loss of capacity over hundreds of cycles. A healthy battery might have 80% of its original range after 3 years. A defect, however, often looks like a sudden, dramatic drop in performance or a total failure to charge.

A significant portion of after-sales disputes we mediate stem from this exact question. Customers rightly want what they paid for, but the expectation of zero capacity loss over time is unrealistic for any lithium-ion battery. The industry term for a battery's health is "State of Health" (SoH), and its "end of useful life" is typically defined as when SoH drops below 80%.12 For a quality battery, this usually happens after about 500 full charge-discharge cycles. Think of it like the tread on a tire; it's designed to wear down with use. A manufacturing defect is different. It's like a tire that suddenly goes flat because of a faulty valve. If your range slowly decreases from 40 miles to 32 miles over three years, that's normal degradation. If it drops from 40 miles to 10 miles in three months, or the BMS suddenly cuts power on a hill you used to climb easily, that points to a potential defect with the cells or the BMS.
Quick Checklist: Degradation vs. Defect
- Gradual range loss over 2+ years: Likely normal degradation.
- Battery won't charge past 50% after 6 months: Likely a defect (cell imbalance).
- Battery casing is swelling or cracking: Serious defect, stop using immediately.
- Range drops by over half in a short period: Likely a defect.
- Bike shuts off with 30% charge left on display: Likely a defect (BMS or cell issue).
Conclusion
Your battery's lifespan is not one number. It is determined by cell quality, smart usage, and realistic expectations. Focus on these factors, not just specs, for the best long-term value.
"[PDF] A Closed Loop Process for the End-of-Life Electric Vehicle Li-ion ...", https://www.energy.gov/sites/default/files/2021-06/bat293_wang_2021_p_5-12_227pm_LR_TM.pdf. A technical or institutional source on lithium-ion battery aging can support that battery end-of-life is commonly associated with capacity falling to about 80% of initial capacity and that cycle life varies by chemistry and operating conditions; it may not verify the exact 3–5 year figure for every e-bike pack. Evidence role: statistic; source type: research. Supports: Quality e-bike lithium-ion batteries commonly last roughly 3 to 5 years or 500 to 800 full cycles before dropping below 80% capacity.. Scope note: The source is likely to support typical lithium-ion end-of-life conventions and cycle-life ranges, but exact e-bike lifespan depends on pack design, cell chemistry, BMS settings, and use conditions. ↩
"[PDF] Comprehensive Modeling of Temperature-Dependent Degradation ...", https://docs.nrel.gov/docs/fy18osti/70616.pdf. Battery-aging literature can support that cell chemistry, manufacturing quality, depth of discharge, temperature, charging rate, and storage state of charge materially affect lithium-ion degradation; such evidence would contextualize rather than directly rank these factors against marketing specifications. Evidence role: general_support; source type: paper. Supports: Battery service life is strongly influenced by internal cell quality and user behavior, not only by nominal specifications.. Scope note: The source may demonstrate the importance of cell and usage factors without directly evaluating e-bike advertising claims. ↩
"Protocol for conducting advanced cyclic tests in lithium-ion batteries ...", https://pmc.ncbi.nlm.nih.gov/articles/PMC10943045/. Standards or laboratory-testing descriptions for rechargeable batteries can support that cycle-life tests specify controlled temperatures, charge/discharge rates, and discharge limits; this supports the contrast with uncontrolled real-world use but may not apply to every manufacturer’s published e-bike specification. Evidence role: mechanism; source type: institution. Supports: Published cycle-life ratings are usually derived from controlled laboratory test conditions.. Scope note: Testing protocols vary by standard, chemistry, and manufacturer, so the citation should not imply one universal e-bike test condition. ↩
"Lithium-Ion Batteries under Low-Temperature Environment - PMC", https://pmc.ncbi.nlm.nih.gov/articles/PMC9698970/. Peer-reviewed battery-aging studies can support that deep discharge, high or low temperatures, and charging conditions accelerate lithium-ion capacity fade; however, the precise 40–60% reduction should be cited only if a source directly reports a comparable magnitude. Evidence role: statistic; source type: paper. Supports: Deep discharges, temperature extremes, and charging practices can substantially reduce practical cycle life compared with controlled test ratings.. Scope note: Many sources support the direction of the effect, but the 40–60% figure requires direct quantitative evidence under comparable conditions. ↩
"[PDF] Cycle Life of Lithium-ion Batteries in Combination with ...", https://steps.ucdavis.edu/wp-content/uploads/2017/05/BURKE-ZHAO-EVS30Lifecyclepaper2017_ver1.pdf. Battery-aging research on depth of discharge can support that deeper discharge cycles generally increase degradation relative to shallower cycles; the evidence is mechanistic and may vary by lithium-ion chemistry and pack management limits. Evidence role: mechanism; source type: paper. Supports: Deep discharge cycles are generally more stressful for lithium-ion batteries than shallower partial cycles.. Scope note: Exact degradation differences depend on cell chemistry, voltage limits, and the BMS-defined usable capacity window. ↩
"[PDF] Addressing the Impact of Temperature Extremes on Large Format Li ...", https://docs.nrel.gov/docs/fy13osti/58145.pdf. A battery research or institutional source can support that lithium-ion cells age faster or experience performance limitations when operated or charged outside moderate temperature ranges; it may not specifically measure e-bike riding in all climates. Evidence role: mechanism; source type: research. Supports: Cold and hot operating environments can stress lithium-ion battery cells and affect performance or aging.. Scope note: The support is about lithium-ion cell temperature sensitivity generally, not necessarily every e-bike pack design or riding scenario. ↩
"Accelerated lithium-ion battery cycle lifetime testing by condition ...", https://www.sciencedirect.com/science/article/pii/S2950345024000198. Battery-testing standards and manufacturer-independent lab protocols commonly use room-temperature conditions around 20–25°C for performance and cycle-life testing; this supports the use of 25°C as a controlled benchmark rather than a guarantee of universal test practice. Evidence role: historical_context; source type: institution. Supports: Controlled battery tests commonly use room-temperature conditions such as about 25°C.. Scope note: Some standards or manufacturers use different temperatures, so the source should be framed as common testing practice, not an absolute rule. ↩
"[PDF] State of Charge Estimation of Cells in Series Connection by Using ...", https://websites.umich.edu/~annastef/papers_battery/Lin2013ACC.pdf. Institutional battery-care guidance can support that lithium-ion batteries are commonly recommended to be stored at a partial state of charge, often around 40–60%, to limit aging during storage; this is guidance rather than proof that 50% is optimal for all packs. Evidence role: expert_consensus; source type: institution. Supports: Lithium-ion batteries are generally best stored at a partial state of charge, approximately around 50%.. Scope note: Recommended storage state of charge varies by manufacturer, chemistry, and storage duration. ↩
"Evaluation of Cell Inconsistency in Lithium-Ion Battery Pack Using ...", https://ui.adsabs.harvard.edu/abs/2023ITII...19.6337J/abstract. Battery-pack engineering literature can support that cell quality/consistency and BMS functions such as balancing, overcharge, over-discharge, and thermal protection are central to lithium-ion pack longevity and safety; it will not necessarily validate specific brand comparisons. Evidence role: mechanism; source type: paper. Supports: Cell quality and BMS quality are major determinants of lithium-ion battery pack lifespan and safety.. Scope note: Neutral sources can support the importance of cell consistency and BMS design, but brand hierarchy claims require separate market or manufacturer-quality evidence. ↩
"Evaluation of Cell Inconsistency in Lithium-Ion Battery Pack Using ...", https://ui.adsabs.harvard.edu/abs/2023ITII...19.6337J/abstract. A source on lithium-ion cell manufacturing variability or cell-to-cell inconsistency can support that more consistent cells improve pack behavior and aging predictability; it should not be used as direct proof that named brands always outperform all alternatives unless the source provides comparative data. Evidence role: mechanism; source type: paper. Supports: Greater cell consistency is associated with more predictable degradation in lithium-ion battery packs.. Scope note: The likely evidence supports the effect of cell consistency on aging, not a universal ranking of specific commercial brands. ↩
"Lithium-ion Battery Management System: A review - ADS", https://ui.adsabs.harvard.edu/abs/2022pect.conf...13D/abstract. A technical overview of battery management systems can support that a BMS monitors and controls key pack functions, including voltage, current, temperature, state estimation, balancing, and protection; the phrase “brain” is metaphorical rather than a technical term. Evidence role: definition; source type: education. Supports: A battery management system monitors and controls key battery-pack functions.. Scope note: The source defines BMS functions; it does not literally characterize the BMS as a brain. ↩
"[PDF] Physical Interpretation of Early Battery Life Prediction Models", https://docs.nrel.gov/docs/fy25osti/92272.pdf. Battery standards and research literature commonly define lithium-ion battery end-of-life for traction or rechargeable applications as the point at which capacity falls to about 80% of rated capacity; this convention may differ by application, warranty, or safety criterion. Evidence role: definition; source type: paper. Supports: Lithium-ion battery end-of-life is often defined as state of health or capacity falling below about 80% of initial/rated capacity.. Scope note: The 80% threshold is common but not universal across all battery applications or manufacturers. ↩